Investor Relations
Financial
Information
Financial
Information


| Fin. Stat. | Financial Description | Fiscal Year of '2009 |
Fiscal Year of '2010 |
Fiscal Year of '2011 |
|---|---|---|---|---|
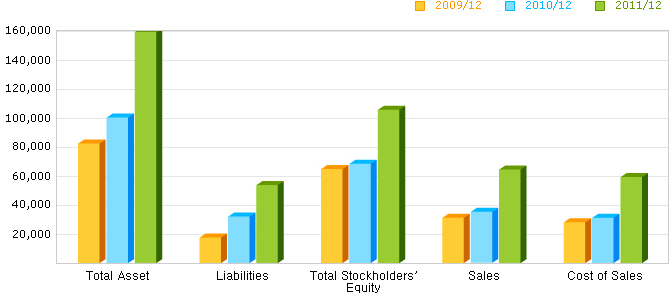
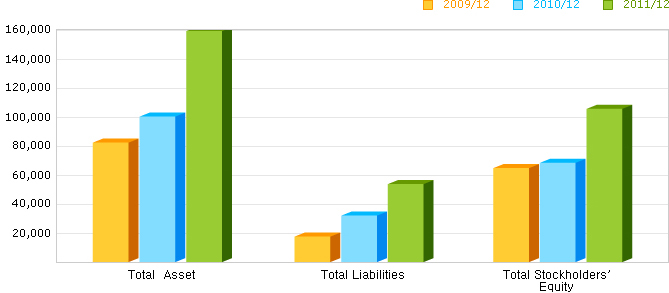
| B/S | Total Asset (KRW Million) |
82,464 | 100,369 | 159,373 |
| Total Liabilities (KRW Million) |
17,651 | 31,993 | 53,709 | |
| Total Stockholders' Equity (KRW Million) |
64,812 | 68,376 | 105,664 | |
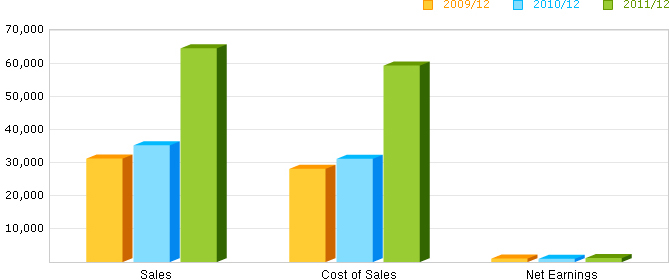
| P/L | Sales (KRW Million) |
31,191 | 35,252 | 64,498 |
| Cost of Sales (KRW Million) |
28,158 | 31,163 | 59,259 | |
| Net Earnings (KRW Million) |
1,080 | 1,009 | 1,190 |

| Fin. Stat. |
Financial Description |
Fiscal Year of '2009 | Fiscal Year of '2010 | Fiscal Year of '2011 | |||
|---|---|---|---|---|---|---|---|
| Amount (KRW Million) |
Composition (%) |
Amount (KRW Million) |
Composition
(%) |
Amount (KRW Million) |
Composition (%) |
||
| B / S | Current Asset | 19,767 | 23.97 | 18,643 | 18.57 | 31,135 | 19.54 |
| Total Asset | 82,464 | 100.00 | 100,369 | 100.00 | 159,373 | 100.00 | |
| Current Liabilities | 12,539 | 15.21 | 28,333 | 28.23 | 41,083 | 25.78 | |
| Total Liabilities | 17,651 | 21.40 | 31,993 | 31.88 | 53,709 | 33.70 | |
| Capital Stock | 20,874 | 25.31 | 20,874 | 20.80 | 20,874 | 13.10 | |
| Capital Surplus | 68,443 | 83.00 | 68,443 | 68.19 | 68,443 | 42.95 | |
| Retained Earnings | 10,153 | 12.31 | 11,161 | 11.12 | 50,133 | 31.46 | |
| Capital Adjustment | -34,824 | -42.23 | -34,824 | -34.70 | -34,824 | -21.85 | |
| Total Stockholders' Equity |
64,812 | 78.60 | 68,376 | 68.12 | 105,664 | 66.30 | |

| Fin. Stat. |
Financial Description |
Fiscal Year of '2009 | Fiscal Year of '2010 | Fiscal Year of '2011 | |||
|---|---|---|---|---|---|---|---|
| Amount (KRW Million) |
Composition (%) |
Amount (KRW Million) |
Composition (%) |
Amount (KRW Million) |
Composition (%) |
||
| P / L | Sales | 31,191 | 100.00 | 35,252 | 100.00 | 64,498 | 100.00 |
| Cost of Sales | 28,158 | 90.28 | 31,163 | 88.40 | 59,259 | 91.88 | |
| Gross Profit | 3,033 | 9.72 | 4,089 | 11.60 | 5,239 | 8.12 | |
| Selling & Administrative Expenses |
2,383 | 7.64 | 2,986 | 8.47 | 4,143 | 6.42 | |
| Operating Income | 650 | 2.08 | 1,102 | 3.13 | 1,096 | 1.70 | |
| Non-Operating Income | 3,872 | 12.41 | 2,179 | 6.18 | 3,167 | 4.91 | |
| Non-Operating Expenses | 3,442 | 11.03 | 2,272 | 6.45 | 3,073 | 4.76 | |
| Income before Income Tax |
1,080 | 3.46 | 1,009 | 2.86 | 1,190 | 1.85 | |
| Net Earnings | 1,080 | 3.46 | 1,009 | 2.86 | 1,190 | 1.85 | |


